Build interactive logic maps that read like a story.
LogiMapper turns columns, boxes and arrows into a sharable, browsable picture of how a theory of change, a benefit chain, or a strategy actually hangs together. This guide gets you from a blank page to a published map.
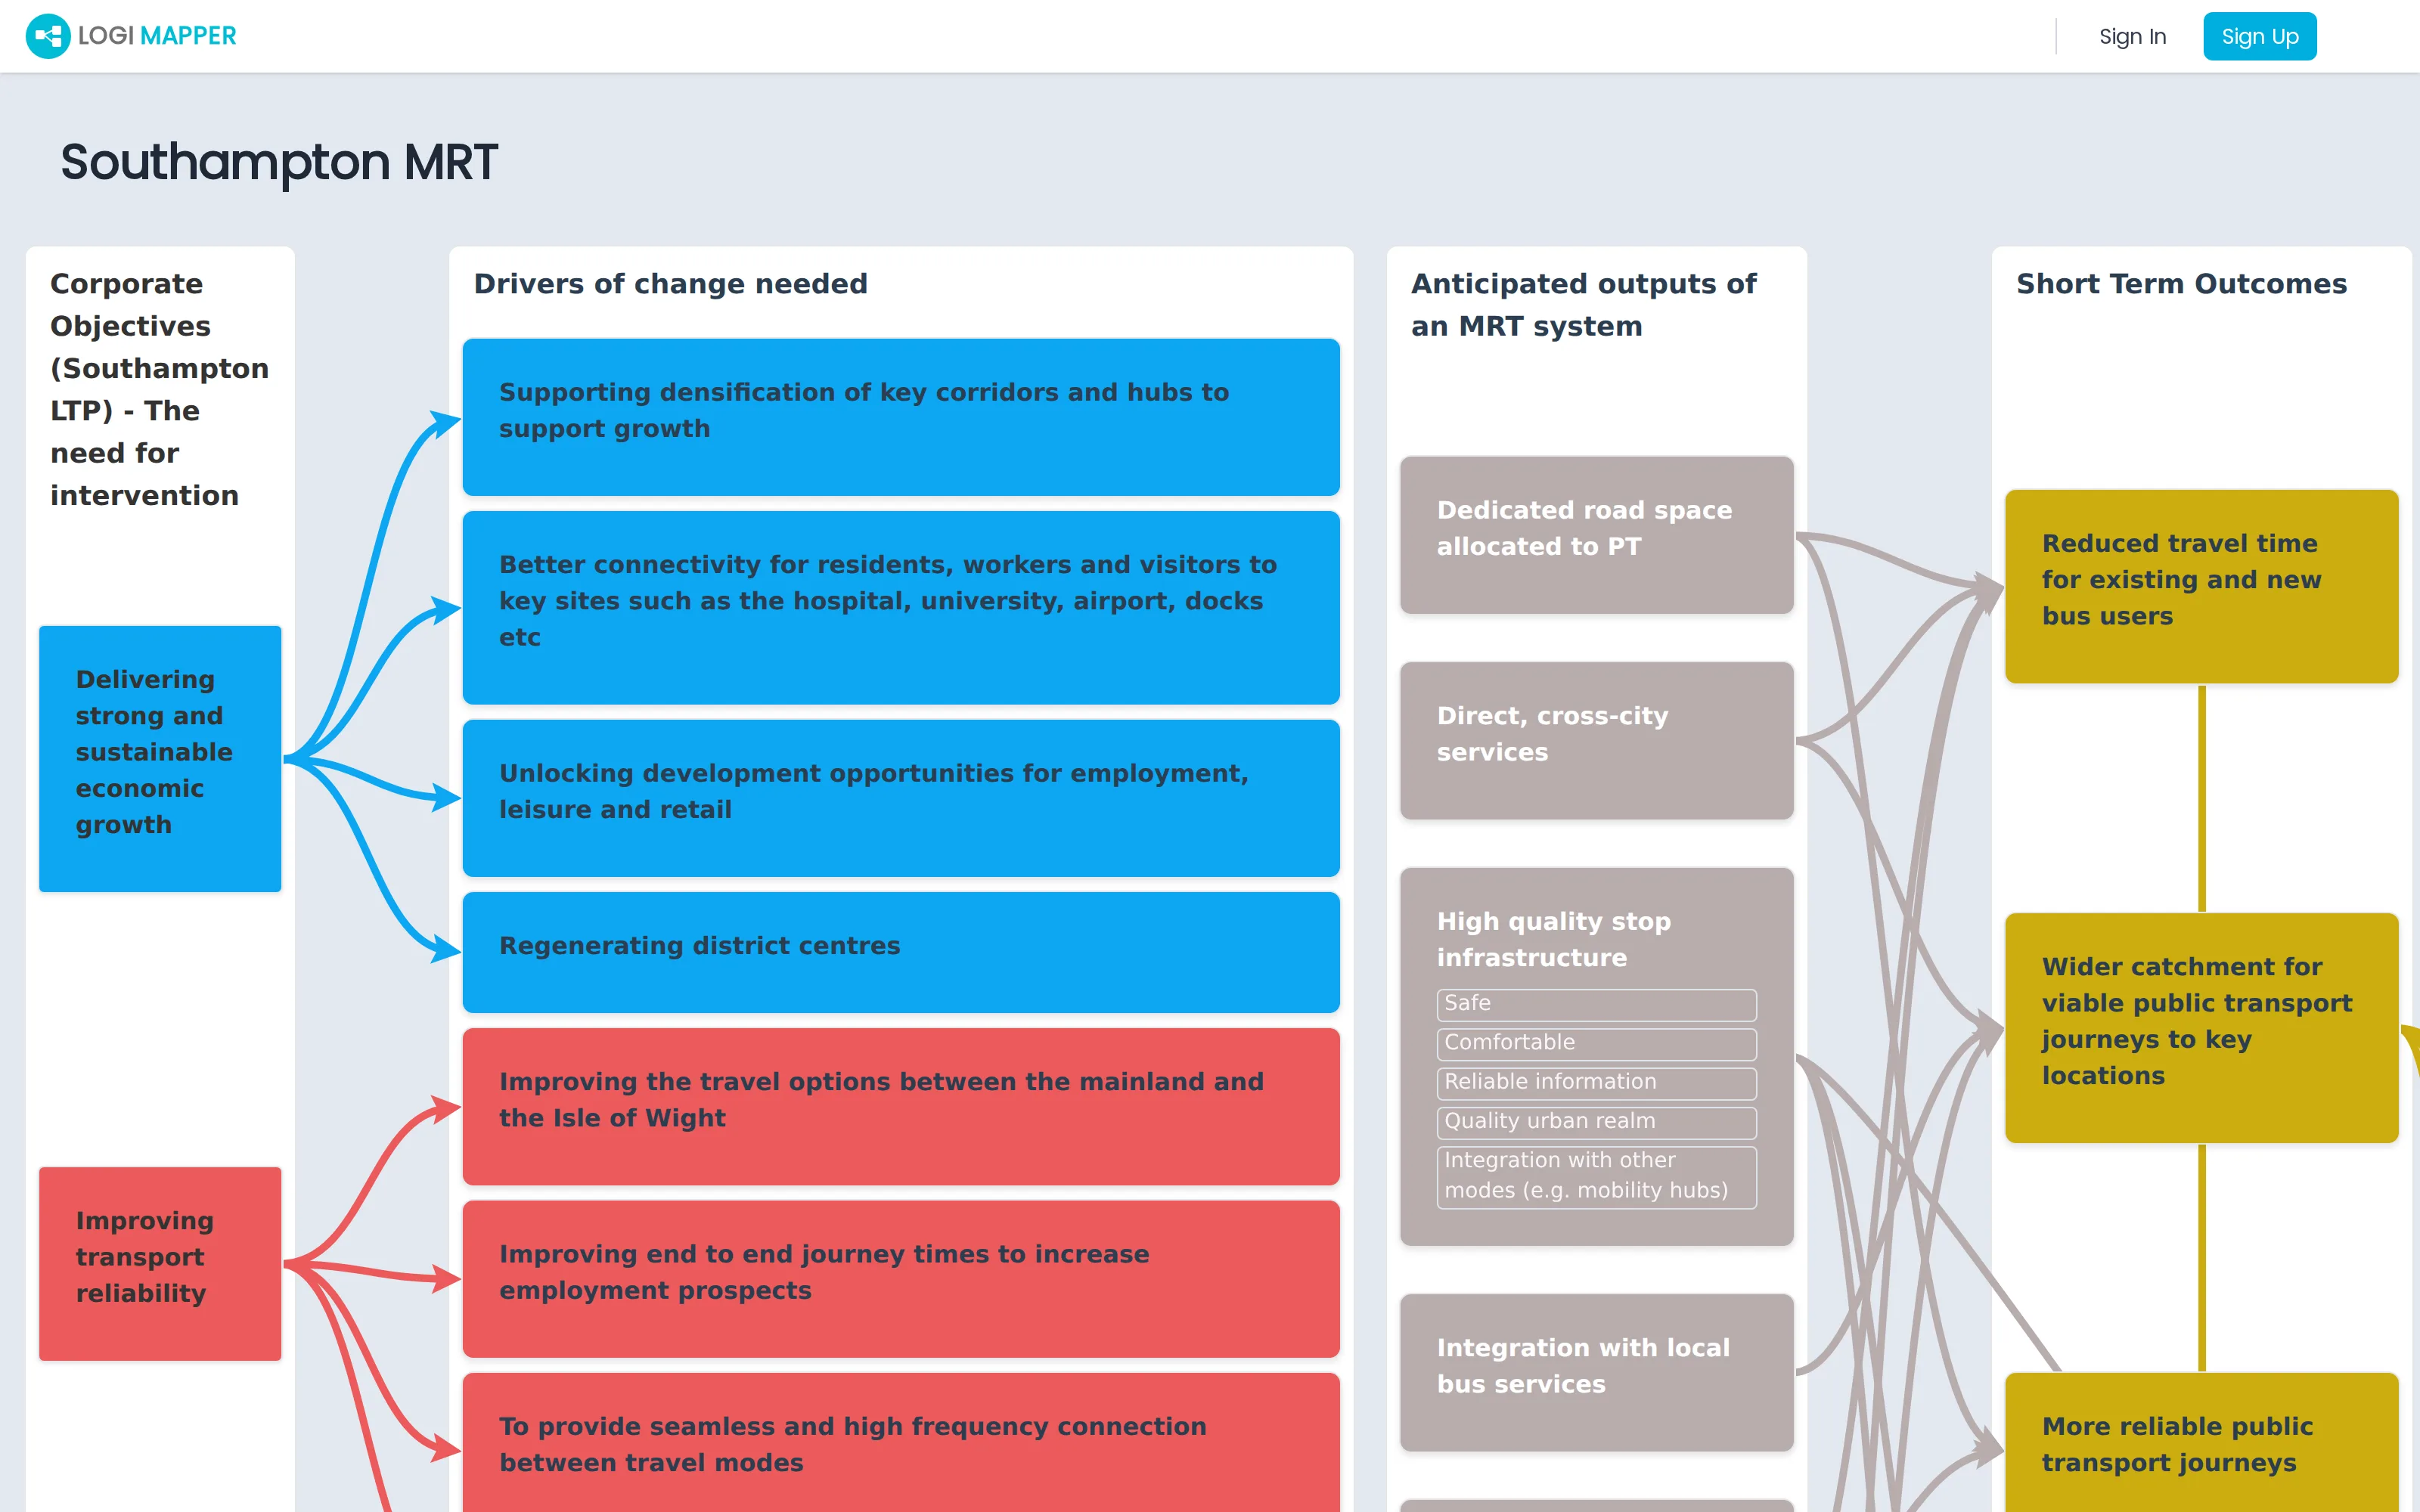
Owners use accounts; viewers can use an access code.
Start from blank, template, JSON or an AI prompt.
Read-only links work anywhere, no software required.
What is a logic map?
A logic map is a left-to-right chain of cause and effect. Each column is a stage (for example: inputs, activities, outputs, outcomes, impacts), each box is a thing happening at that stage, and each arrow says this leads to that. LogiMapper makes those chains interactive: hover an arrow to read its meaning, click a box to highlight only the chain it sits on, and share the whole thing as a single URL.
You don’t have to follow theory-of-change vocabulary. Teams use the same structure to show benefit cascades, forecast driver chains, customer journeys, and scheme-scoring frameworks. The examples page walks through five of those.
Browse the guide
Accounts, signing in, access codes, and roles.
Four ways to start: blank, template, JSON, or AI.
Add, style, and arrange the columns that hold your boxes.
Edit text, set colours, align, and rearrange your boxes.
Draw arrows, style them, and reveal logic chains.
Public links, edit access codes, PDF, PNG, and JSON.
Clients, projects, your map library, and the activity feed.
Conventions that keep large maps legible and meaningful.
Five different ways teams put LogiMapper to work.