Creating your first map
You start every new map from the /create page. There are four ways in. Pick the one that matches how much you already have.
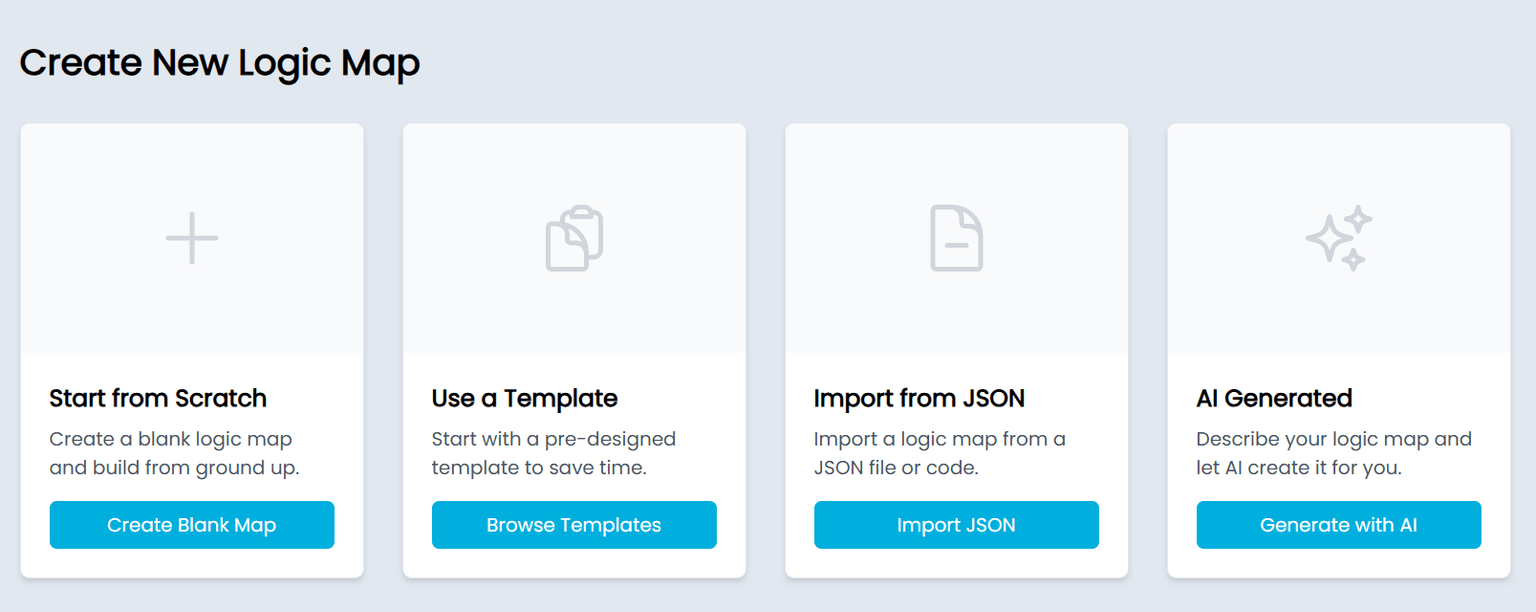
Start blank
A clean canvas with a single empty column. Pick this when you want full control from the outset. You’ll name the map, add columns, then add boxes, in whatever order you prefer.
Start from a template
A pre-populated map in a standard LogiMapper format: five columns labelled Inputs · Activities · Outputs · Outcomes · Impacts, with example boxes you can edit in place. This is the fastest way to get to something that looks like a logic model.
Generate with AI
Describe what you’re mapping in a sentence or two (“a theory of change for a regional active travel programme”) and LogiMapper drafts a starting structure: columns, boxes, and the obvious arrows between them. Treat the output as a first pass; you’ll almost always restructure it, but it gets you past the blank-canvas problem.
Import from JSON
Paste a JSON file exported from another LogiMapper map (see Sharing & exporting) and the structure is rebuilt as a new map. Useful for forking a map you already published, or moving content between environments.
Map-level settings
Once a map is open, a few global settings affect how the whole map looks and behaves. Save As lives on the toolbar; the rest sit inside the Settings and Style modals, which you open from the toolbar.
- Column gap. Adjusts the horizontal space between columns. Tighten this when you have a lot of columns and want everything on a single screen.
- Animation speed. Controls how quickly highlights animate when a box or chain is selected. Most of the time leave it on Fast; switch to Slow when you’re walking a client or stakeholder through a specific chain in a meeting.
- Save As. Duplicates the current map into a new one. Use it before any risky restructure so you can fall back to the previous version. Also useful when sharing an editable version with a third party; keep the original safe.
